Community Training Classes & Labs > F5 Solutions for Kubernetes Index
2.4.3. Node setup
Once the master is setup and running, we need to connect our nodes to it.
2.4.3.1. Join the master
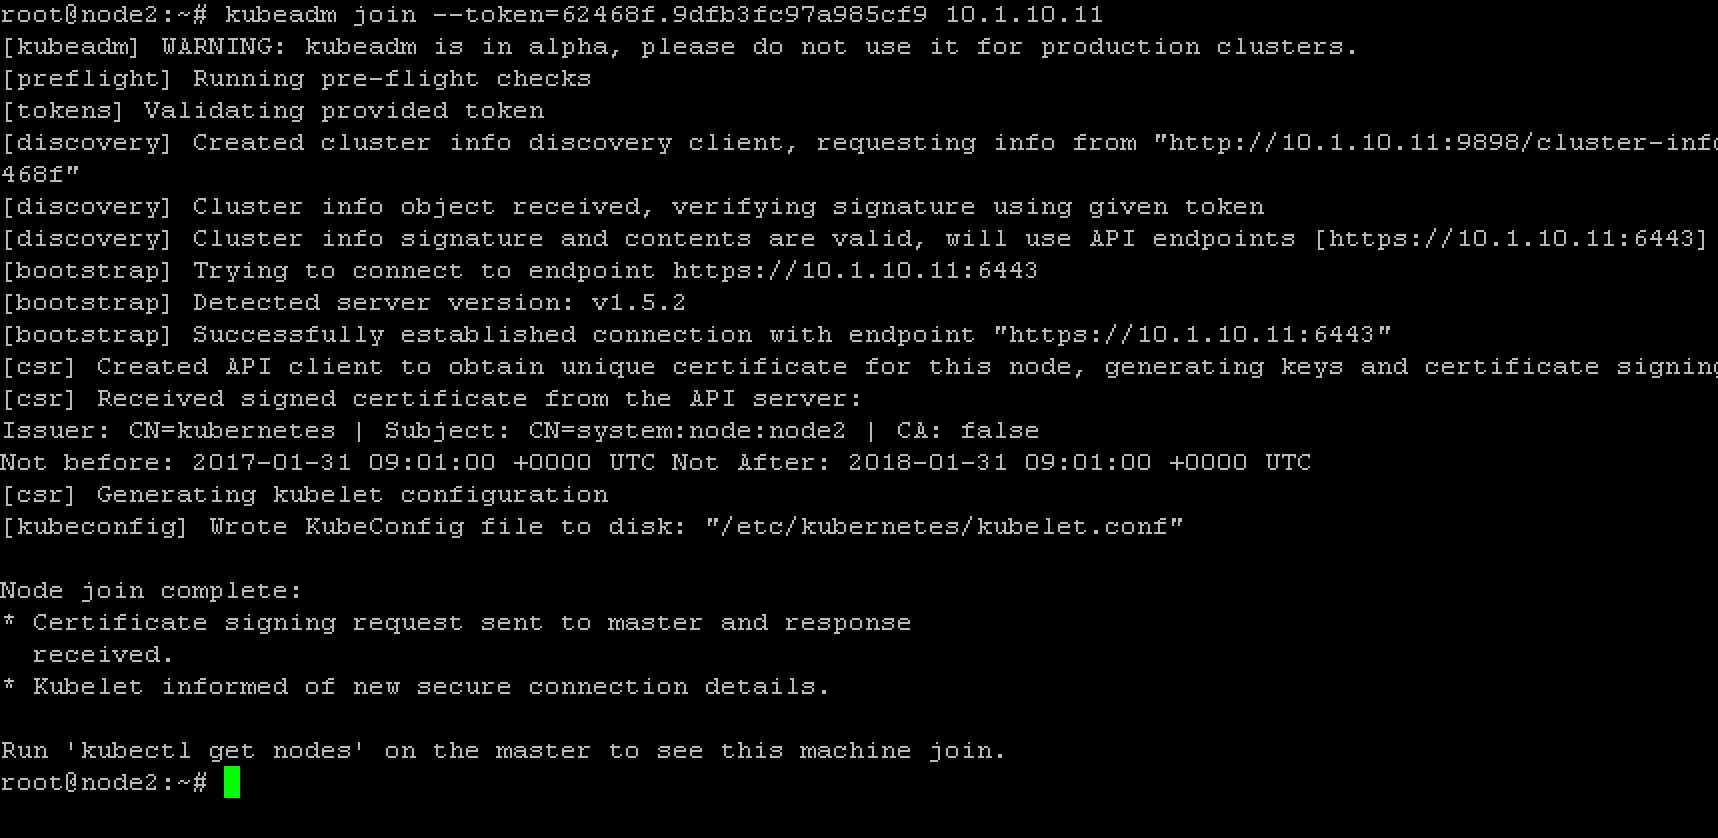
to join the master we need to run the command highlighted during the master initialization. In our setup it was:
sudo kubeadm join --token=62468f.9dfb3fc97a985cf9 10.1.10.11
the output should be like this :
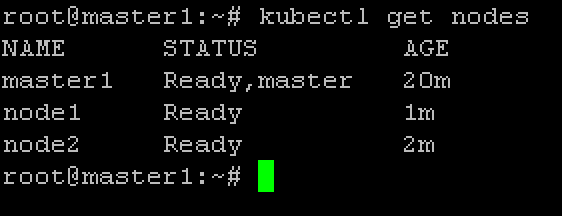
to make sure that your nodes have joined, you can run this command on the master:
kubectl get nodes
You should see your cluster (ie master + nodes)
Check that all the services are started as expected (run on the master):
kubectl get pods --all-namespaces
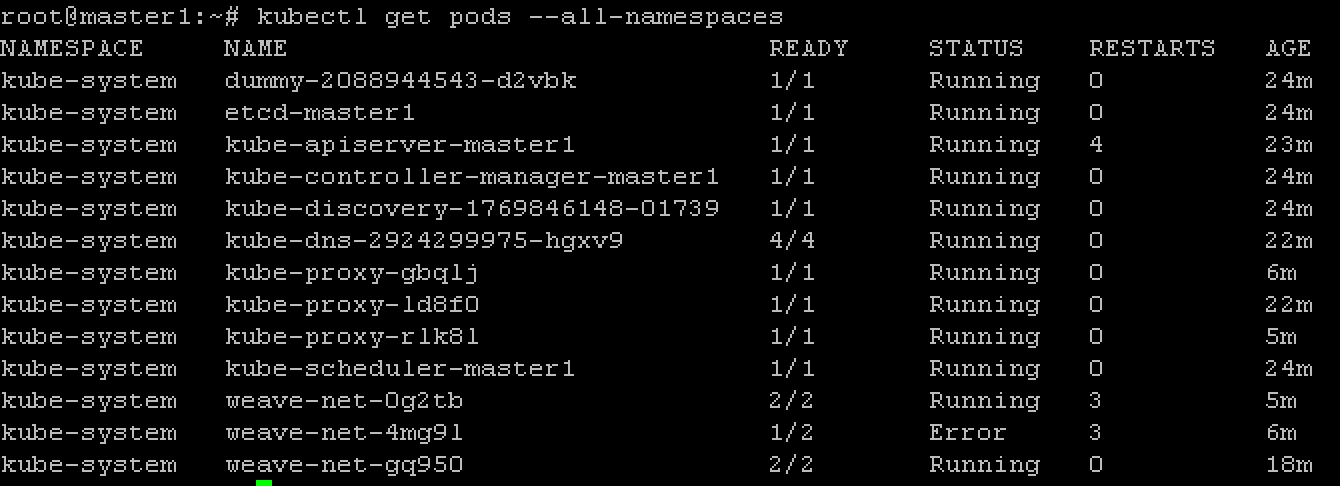
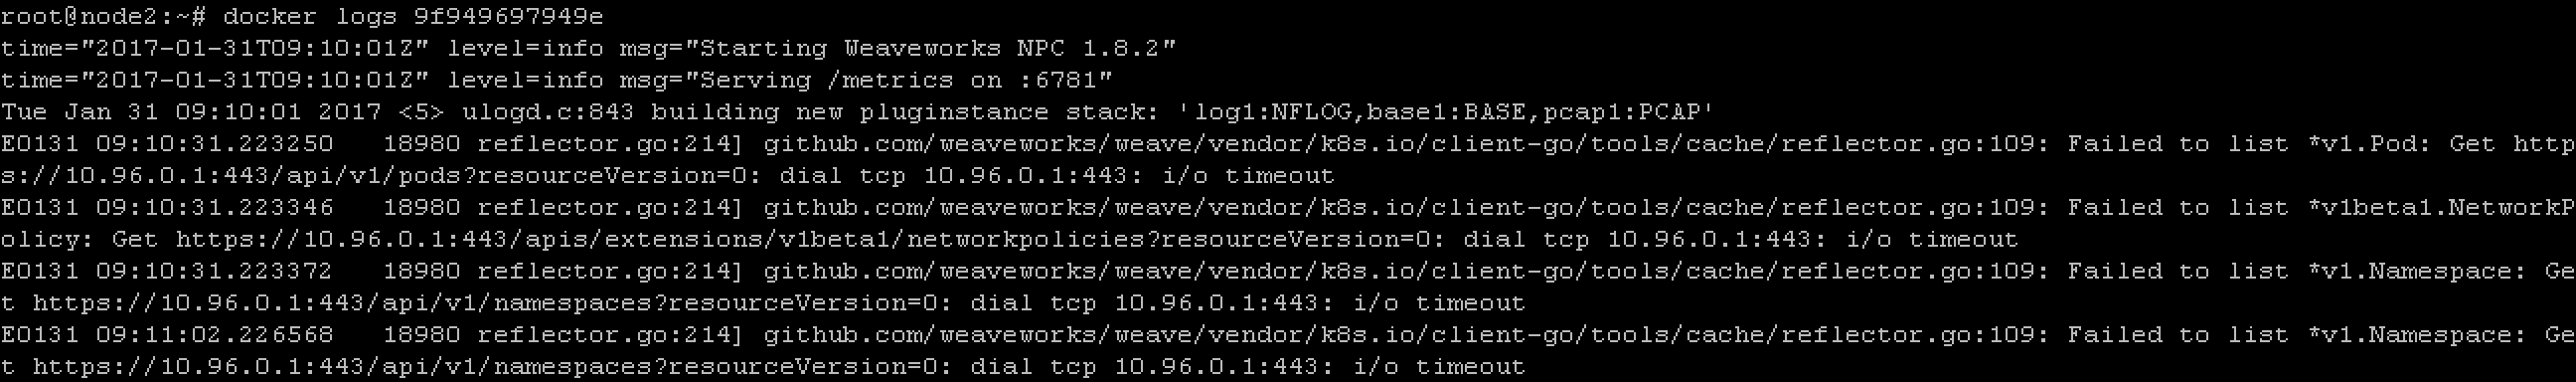
Here we see that some weave net containers keep restarting. This is due to our multi nic setup. Check this link: Deploying Kubernetes 1.4 on Ubuntu Xenial with Kubeadm
You can validate this by connecting to a node and check the logs for the relevant container
to fix this, you need to run the following command on the master:
sudo apt-get install -y jq

kubectl -n kube-system get ds -l 'component=kube-proxy' -o json | jq '.items[0].spec.template.spec.containers[0].command |= .+ ["--cluster-cidr=10.32.0.0/12"]' | kubectl apply -f - && kubectl -n kube-system delete pods -l 'component=kube-proxy'
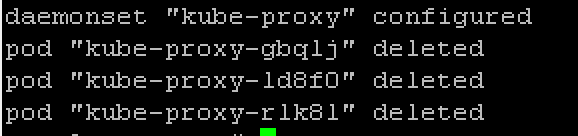
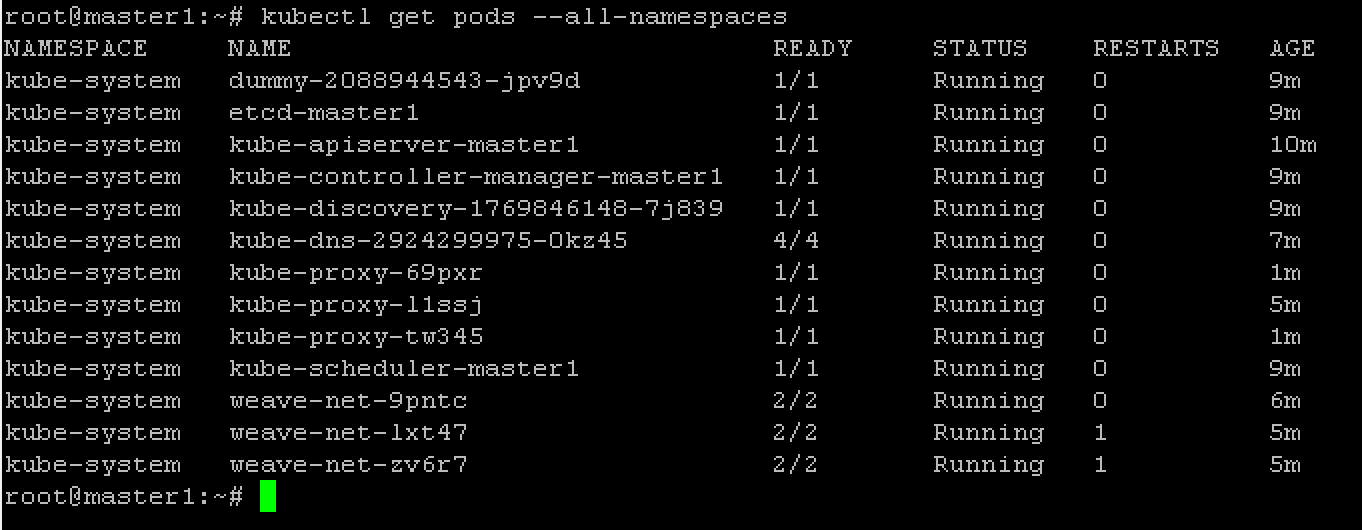
Once this is done, you may check that everything is in a stable “Running” state:
kubectl get pods --all-namespaces
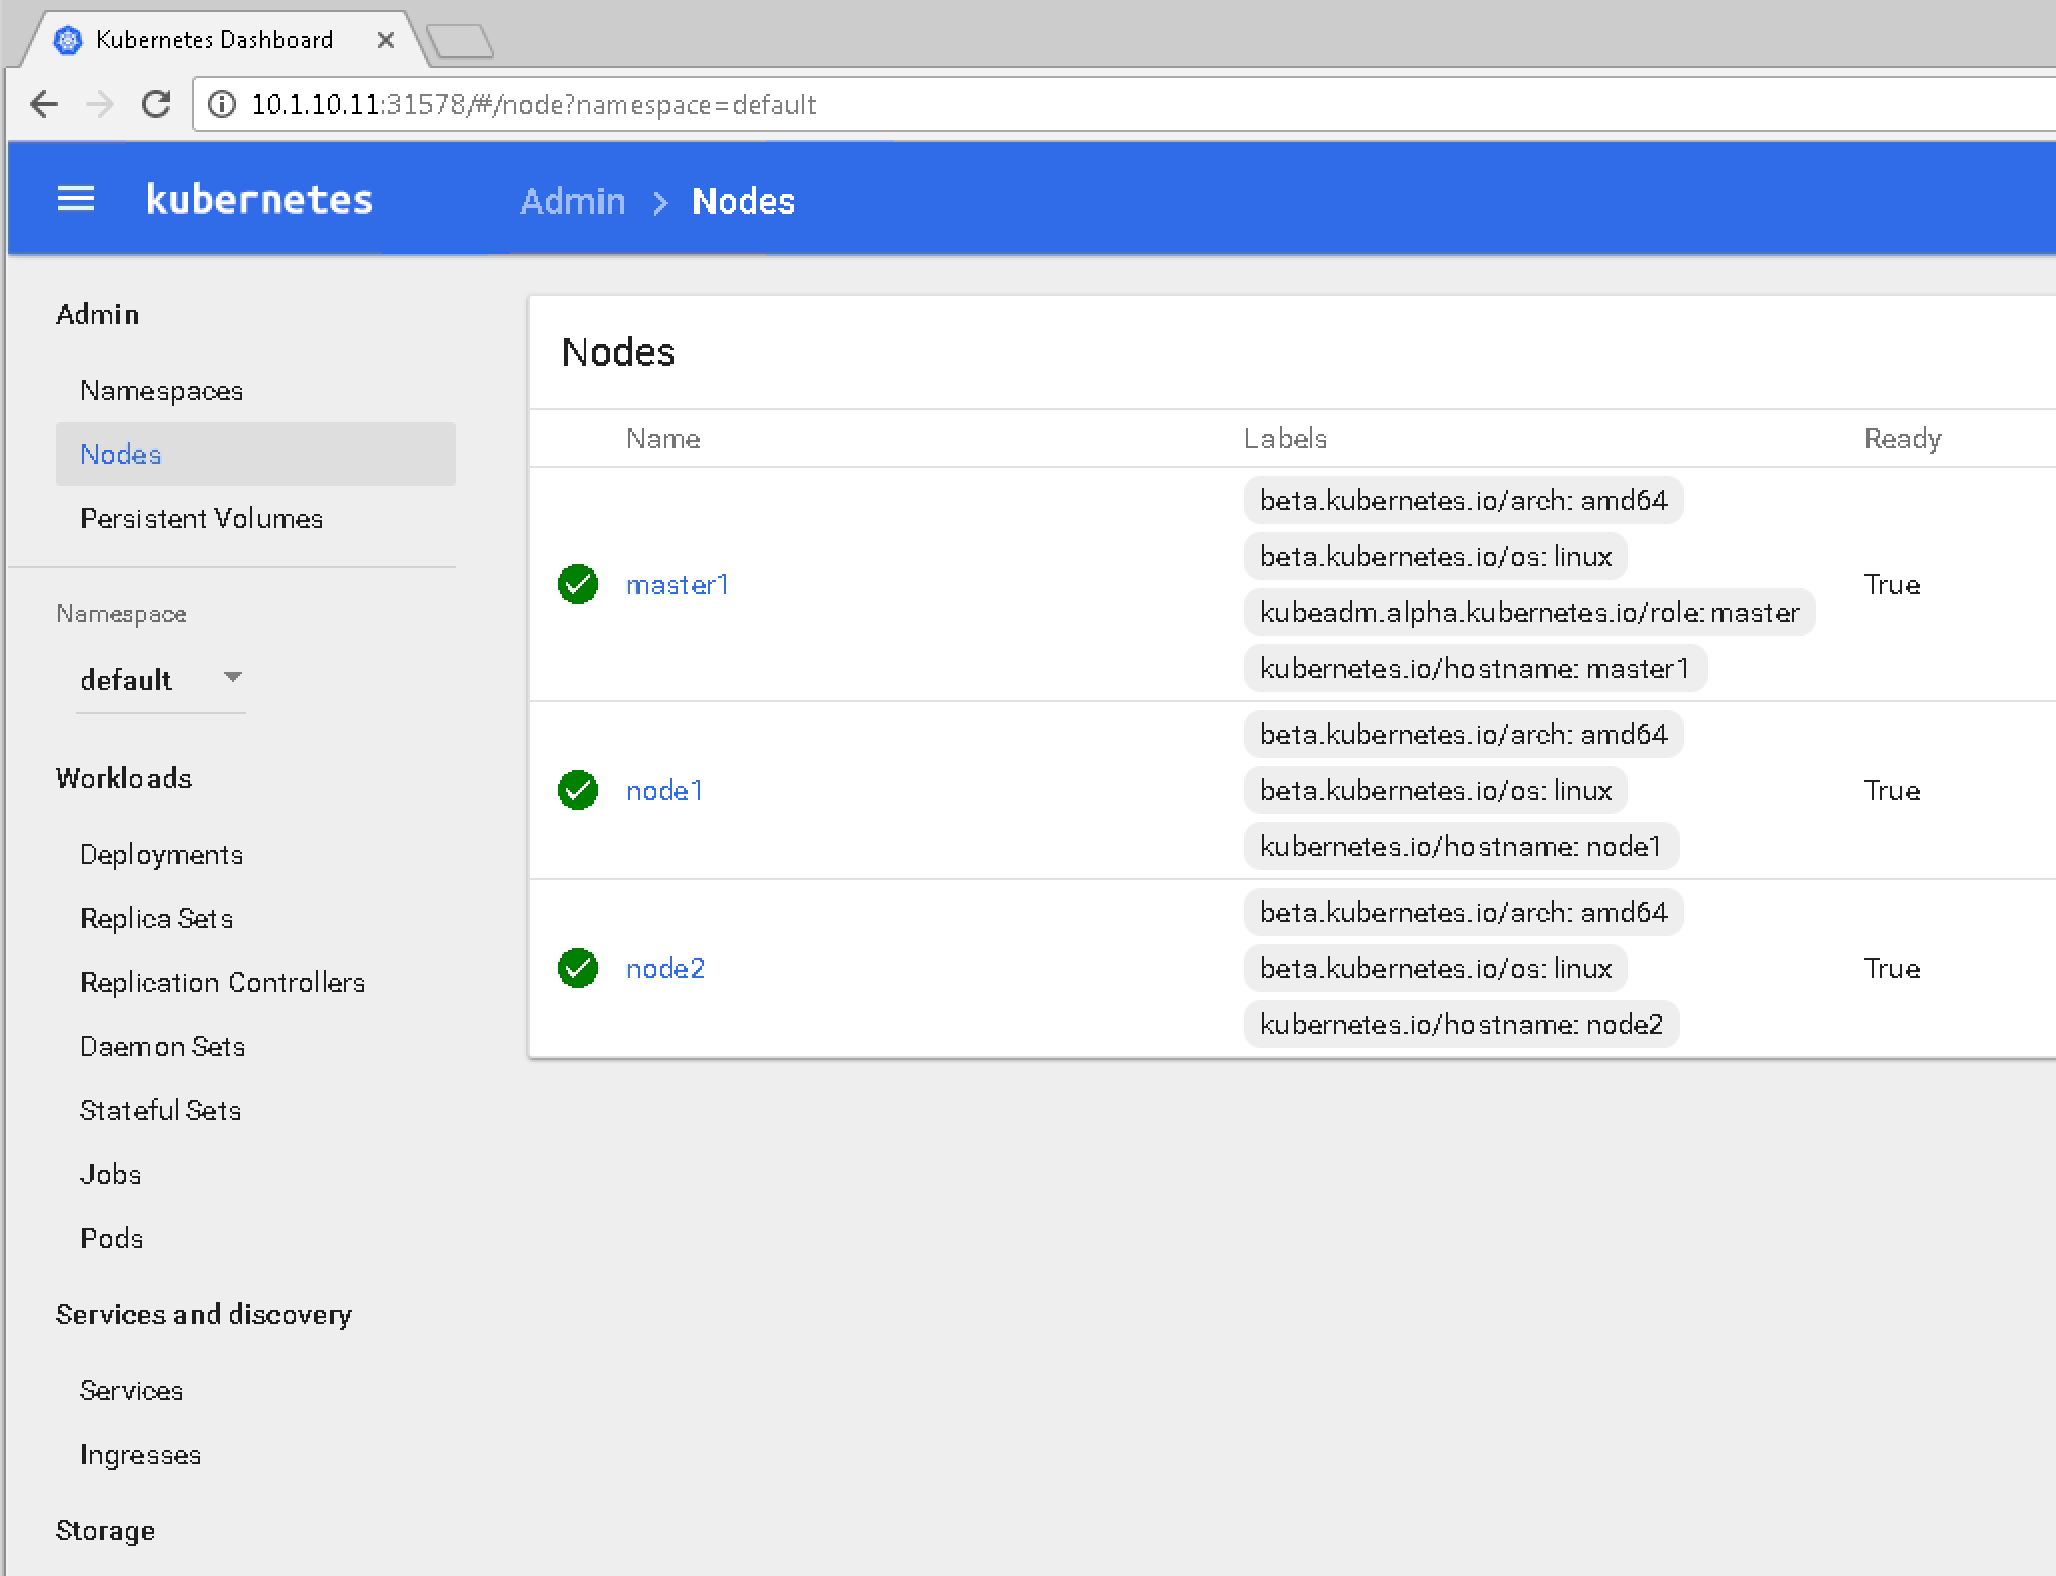
If you want to enable Kubernetes UI, you may install the dashboard. Run the following command on the master
First download a copy of the YAML file to deploy the dashboard.
wget https://git.io/kube-dashboard-no-rbac -O kube-dashboard-no-rbac.yml
Modify the service to be type NodePort
spec:
  ports:
  - port: 80
    targetPort: 9090
  type: NodePort
  selector:
    k8s-app: kubernetes-dashboard
Now run
kubectl create -f kube-dashboard-no-rbac.yml
You should see the following output:
deployment "kubernetes-dashboard" created
service "kubernetes-dashboard" created
to access the dashboard, you need to see on which port it is listening. You can find this information with the following command (on the master):
kubectl describe svc kubernetes-dashboard -n kube-system
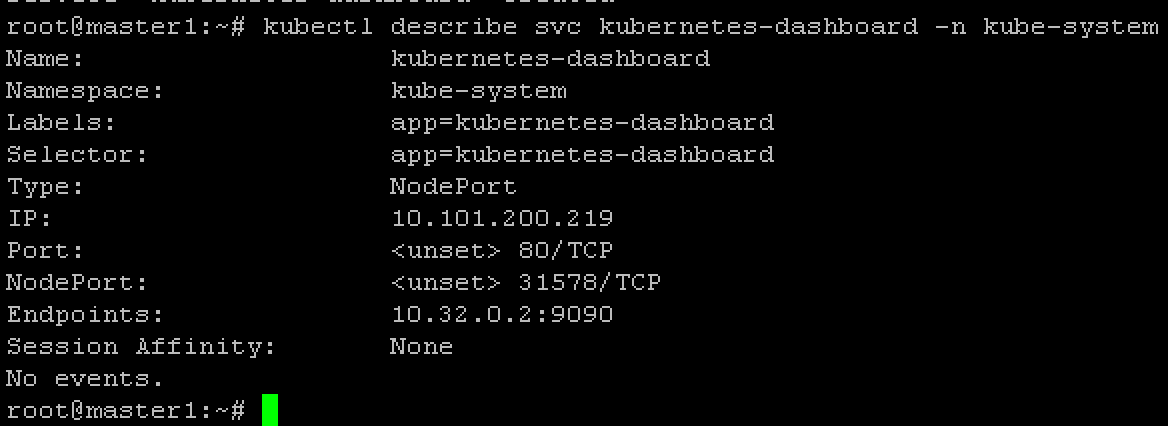
Here we can see that it is listening on port: 31578 (NodePort)
We can now access the dashboard by connecting to the following uri http://<master IP>:31578